

Detecting temperature deviations on the road
Refrigerated goods must stay within the required temperature limits throughout the entire journey. If the temperature in the reefer body stays above the threshold for too long, the load often can no longer be sold. If the deviation is only detected after the trip, it is too late to intervene.
The necessary readings are already captured during the trip. Telematics systems and tracking providers continuously report the position and temperature of every vehicle. What matters is linking these readings to the trip data and analyzing them immediately.
For an international logistics service provider, we built such a solution with Microsoft Fabric. We describe the project, the architecture and what matters in implementation.
In practice: cold chain monitoring at a logistics service provider
The logistics provider delivers refrigerated goods on trips with many stops. The temperature has to be right along the entire route. The goal was to detect deviations while the trip is still underway.
Tracking providers continuously deliver vehicle positions and the temperature readings of the reefer bodies. This data flows into Microsoft Fabric in real time, where it is linked to the trip data from planning: vehicle, route, stops and goods.
Analysis on the data stream detects whether a cold chain has been broken or whether the temperature is heading into a critical range. In case of critical deviations, the people responsible are notified automatically. Power BI shows the temperature history for each trip and vehicle.
Critical situations become visible while the trip is still underway. Dispatch can step in early.
How the solution is built in Microsoft Fabric
The solution runs entirely in Microsoft Fabric. Real-Time Intelligence, the real-time workload in Fabric, covers every step from sensor reading to alert. The architecture follows three phases. Data Science can add predictions on top.
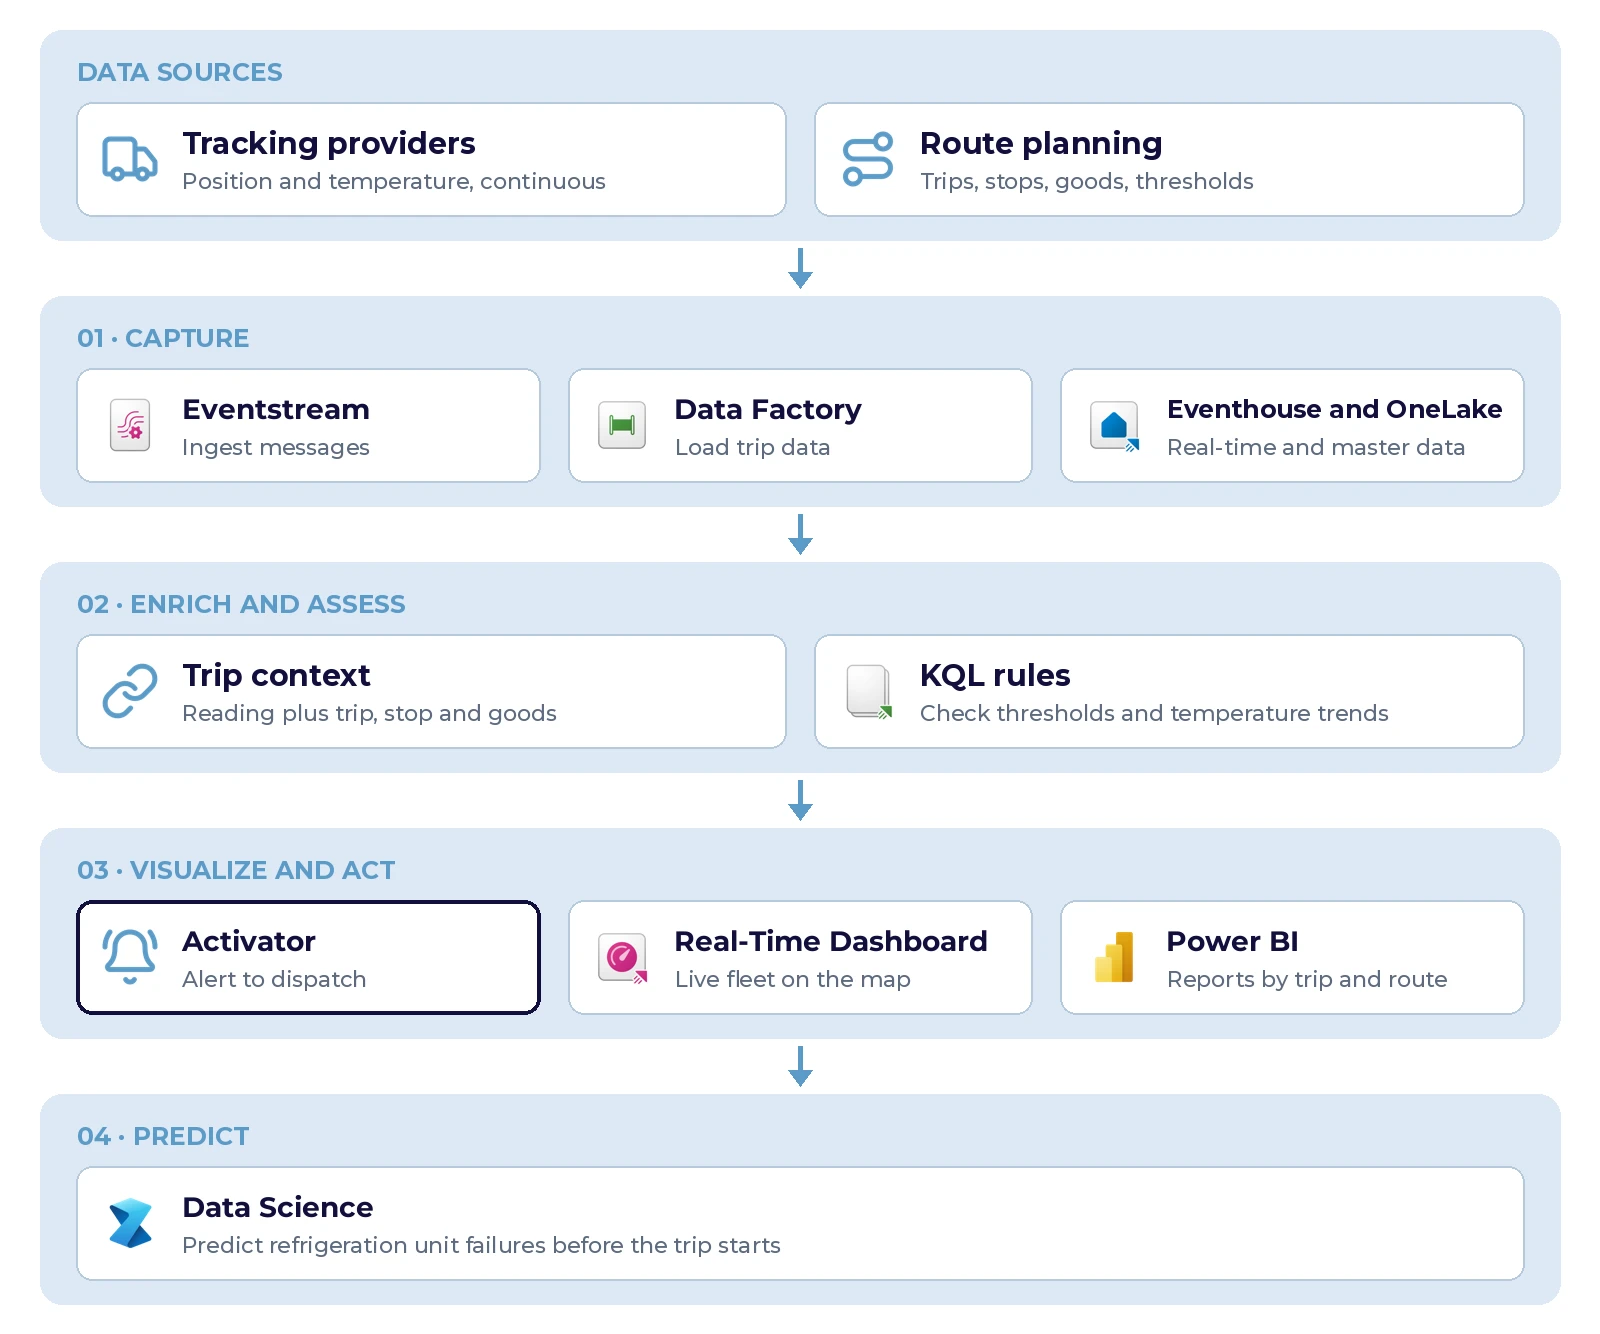
The optional prediction builds on the captured operating data.
The three phases in detail
1. Capture
An eventstream ingests the messages from the tracking providers via their APIs. The data can be filtered and cleaned in the eventstream as soon as it arrives. The eventstream then writes it to an eventhouse, the real-time data store in Fabric. New readings are available for queries within seconds.
Trip data from planning changes more slowly. It is loaded via Data Factory into OneLake, the central data store in Fabric. This includes vehicles, reefer bodies, routes, stops and the thresholds for each type of goods.
2. Enrich and assess
In the eventhouse, every reading is linked to this context. “Vehicle 17 reports 9 °C” becomes: trip 4711, third of eight stops, goods approved up to 7 °C, threshold exceeded for twelve minutes.
Queries in KQL, the query language of the eventhouse, continuously check thresholds and temperature trends. They distinguish a brief spike when the door is opened from a genuine refrigeration failure.
3. Visualize and act
- Activator automatically sends an alert by email or Teams when a situation becomes critical. Power Automate can trigger further steps, such as an entry in the incident log.
- Real-Time Dashboard shows dispatch every vehicle on a map, with the current temperature status for each trip.
- Power BI delivers reports for quality assurance and management, for example on deviations by route, vehicle or customer.
With Copilot in Fabric, queries can also be written in natural language, for example: Which trips had the most deviations this week?
What Fabric makes easier
Compared to a solution built from separate services, Fabric simplifies several things:
- Shared platform. The Fabric components share a common capacity, which makes operations and billing more transparent. Permissions are also managed within the platform.
- Fewer interfaces. Data from the eventhouse can be made available in OneLake. Power BI and other analytics access it directly, without separate copies.
- Alert rules without development. With Activator, business teams set thresholds and recipients themselves. New rules do not require a development project.
Evaluating Microsoft Fabric?
Fabric consulting
We support you from the initial assessment through to running your solution in Microsoft Fabric.
What matters in implementation
Five factors determine success:
- Define thresholds per type of goods. Frozen goods, fresh produce and pharmaceuticals have different temperature ranges. Quality assurance should set these thresholds and be able to adjust them as needed.
- Avoid false alarms. The temperature rises briefly when the door is opened. That is normal and must not trigger an alert. Only the duration of a deviation makes it critical.
- A clean data model. Which reefer body belongs to which vehicle, and which vehicle runs which trip? This mapping is the foundation of every analysis.
- Plan for gaps in the data. Dead zones and delayed messages happen. The analysis must recognize whether a value is missing or whether the connection has simply dropped.
- Role-based permissions. Dispatch, quality assurance and management need different views. Role-based access should be part of the setup from day one.
Outlook: from monitoring to prediction
With enough historical operating data, failures of refrigeration units can also be predicted in the future. A refrigeration unit often signals an impending failure, for example through longer run times or slower cooling after a stop.
Microsoft provides a dedicated reference architecture for predictive maintenance. It uses the same building blocks and adds Data Science in Fabric. Machine learning models learn from historical data when a unit is likely to fail. The workshop can then service it before the next trip starts.
Practical tip
Predictions require operating data over a longer period and documented failures. The operating data captured during monitoring can later serve as the basis for such models.
Conclusion
Microsoft Fabric brings data streaming, storage, alerts and reporting together on one platform. You can start with just a few vehicles and gradually extend the solution to the entire fleet. Predictions can be added later as needed.
Quick answers: FAQ
What does real-time cold chain monitoring mean?
The position and temperature of refrigerated vehicles are captured continuously and linked to the trip data immediately. This makes deviations visible during the trip, not only after delivery.
Which Microsoft Fabric components do you need?
Eventstream ingests the readings, and the eventhouse stores and assesses them with KQL. Activator sends alerts, while Real-Time Dashboard and Power BI make the data visible. Trip data is loaded into OneLake via Data Factory.
How quickly are new readings available?
In the eventhouse, new readings are available for queries and alert rules within seconds.
How do you avoid false alarms when the door is opened?
The alert rules assess not only the threshold but also how long a deviation lasts. A brief spike during unloading does not trigger an alert, but a genuine refrigeration failure does.
Can you start with just a few vehicles?
Yes. The solution can start with a few vehicles and be extended gradually to the entire fleet. Failure prediction can be added later.
Questions about cold chain monitoring?
We have already delivered a solution like this and can support you with connecting your vehicle data, monitoring and ongoing operations.
oneLake GmbH is a Microsoft Solutions Partner for Data & AI and Analytics on Azure. We help companies build data platforms with Microsoft Fabric, Azure and Power BI.
The customer story has been anonymized. Microsoft Fabric features are evolving continuously; the current documentation on Microsoft Learn is authoritative.
Sources
[1] Microsoft Learn, “Real-Time Intelligence in Microsoft Fabric.” https://learn.microsoft.com/en-us/fabric/real-time-intelligence/overview (accessed: November 2026)
[2] Microsoft Learn, “Predictive maintenance reference architecture.” https://learn.microsoft.com/en-us/fabric/real-time-intelligence/architectures/predictive-maintenance (accessed: November 2026)


